25 Call Center KPIs for Team Managers: Everything You Should Know

17 mins read

Posted on May 06, 2024


Vignesh N
SEO


Vignesh N
SEO


As you set up a call center for businesses, it is crucial to consider various factors that will impact the work operations for a long time. In this blog, let us discuss the 25 call center KPIs that will boost and track the performance of every business.
What is a Call Center KPI?
KPI stands for Key Performance Indicator. They are similar to life jackets, which are saviors that keep you afloat and help you reach the shore. KPIs provide you with greater visibility into your business data and present trends. With this deeper transparency on the business details, you can put some effort into elevating your brand by implementing the required activities.
KPI is a measurable value or values that showcase how efficiently the business, the department, a team, or an individual is achieving the goals. Depending on the metrics you want to monitor or what industry you are in, the KPIs will change accordingly.
To put it simply, a call center KPI will let you know the metrics of different evaluation factors that you use in a Call center
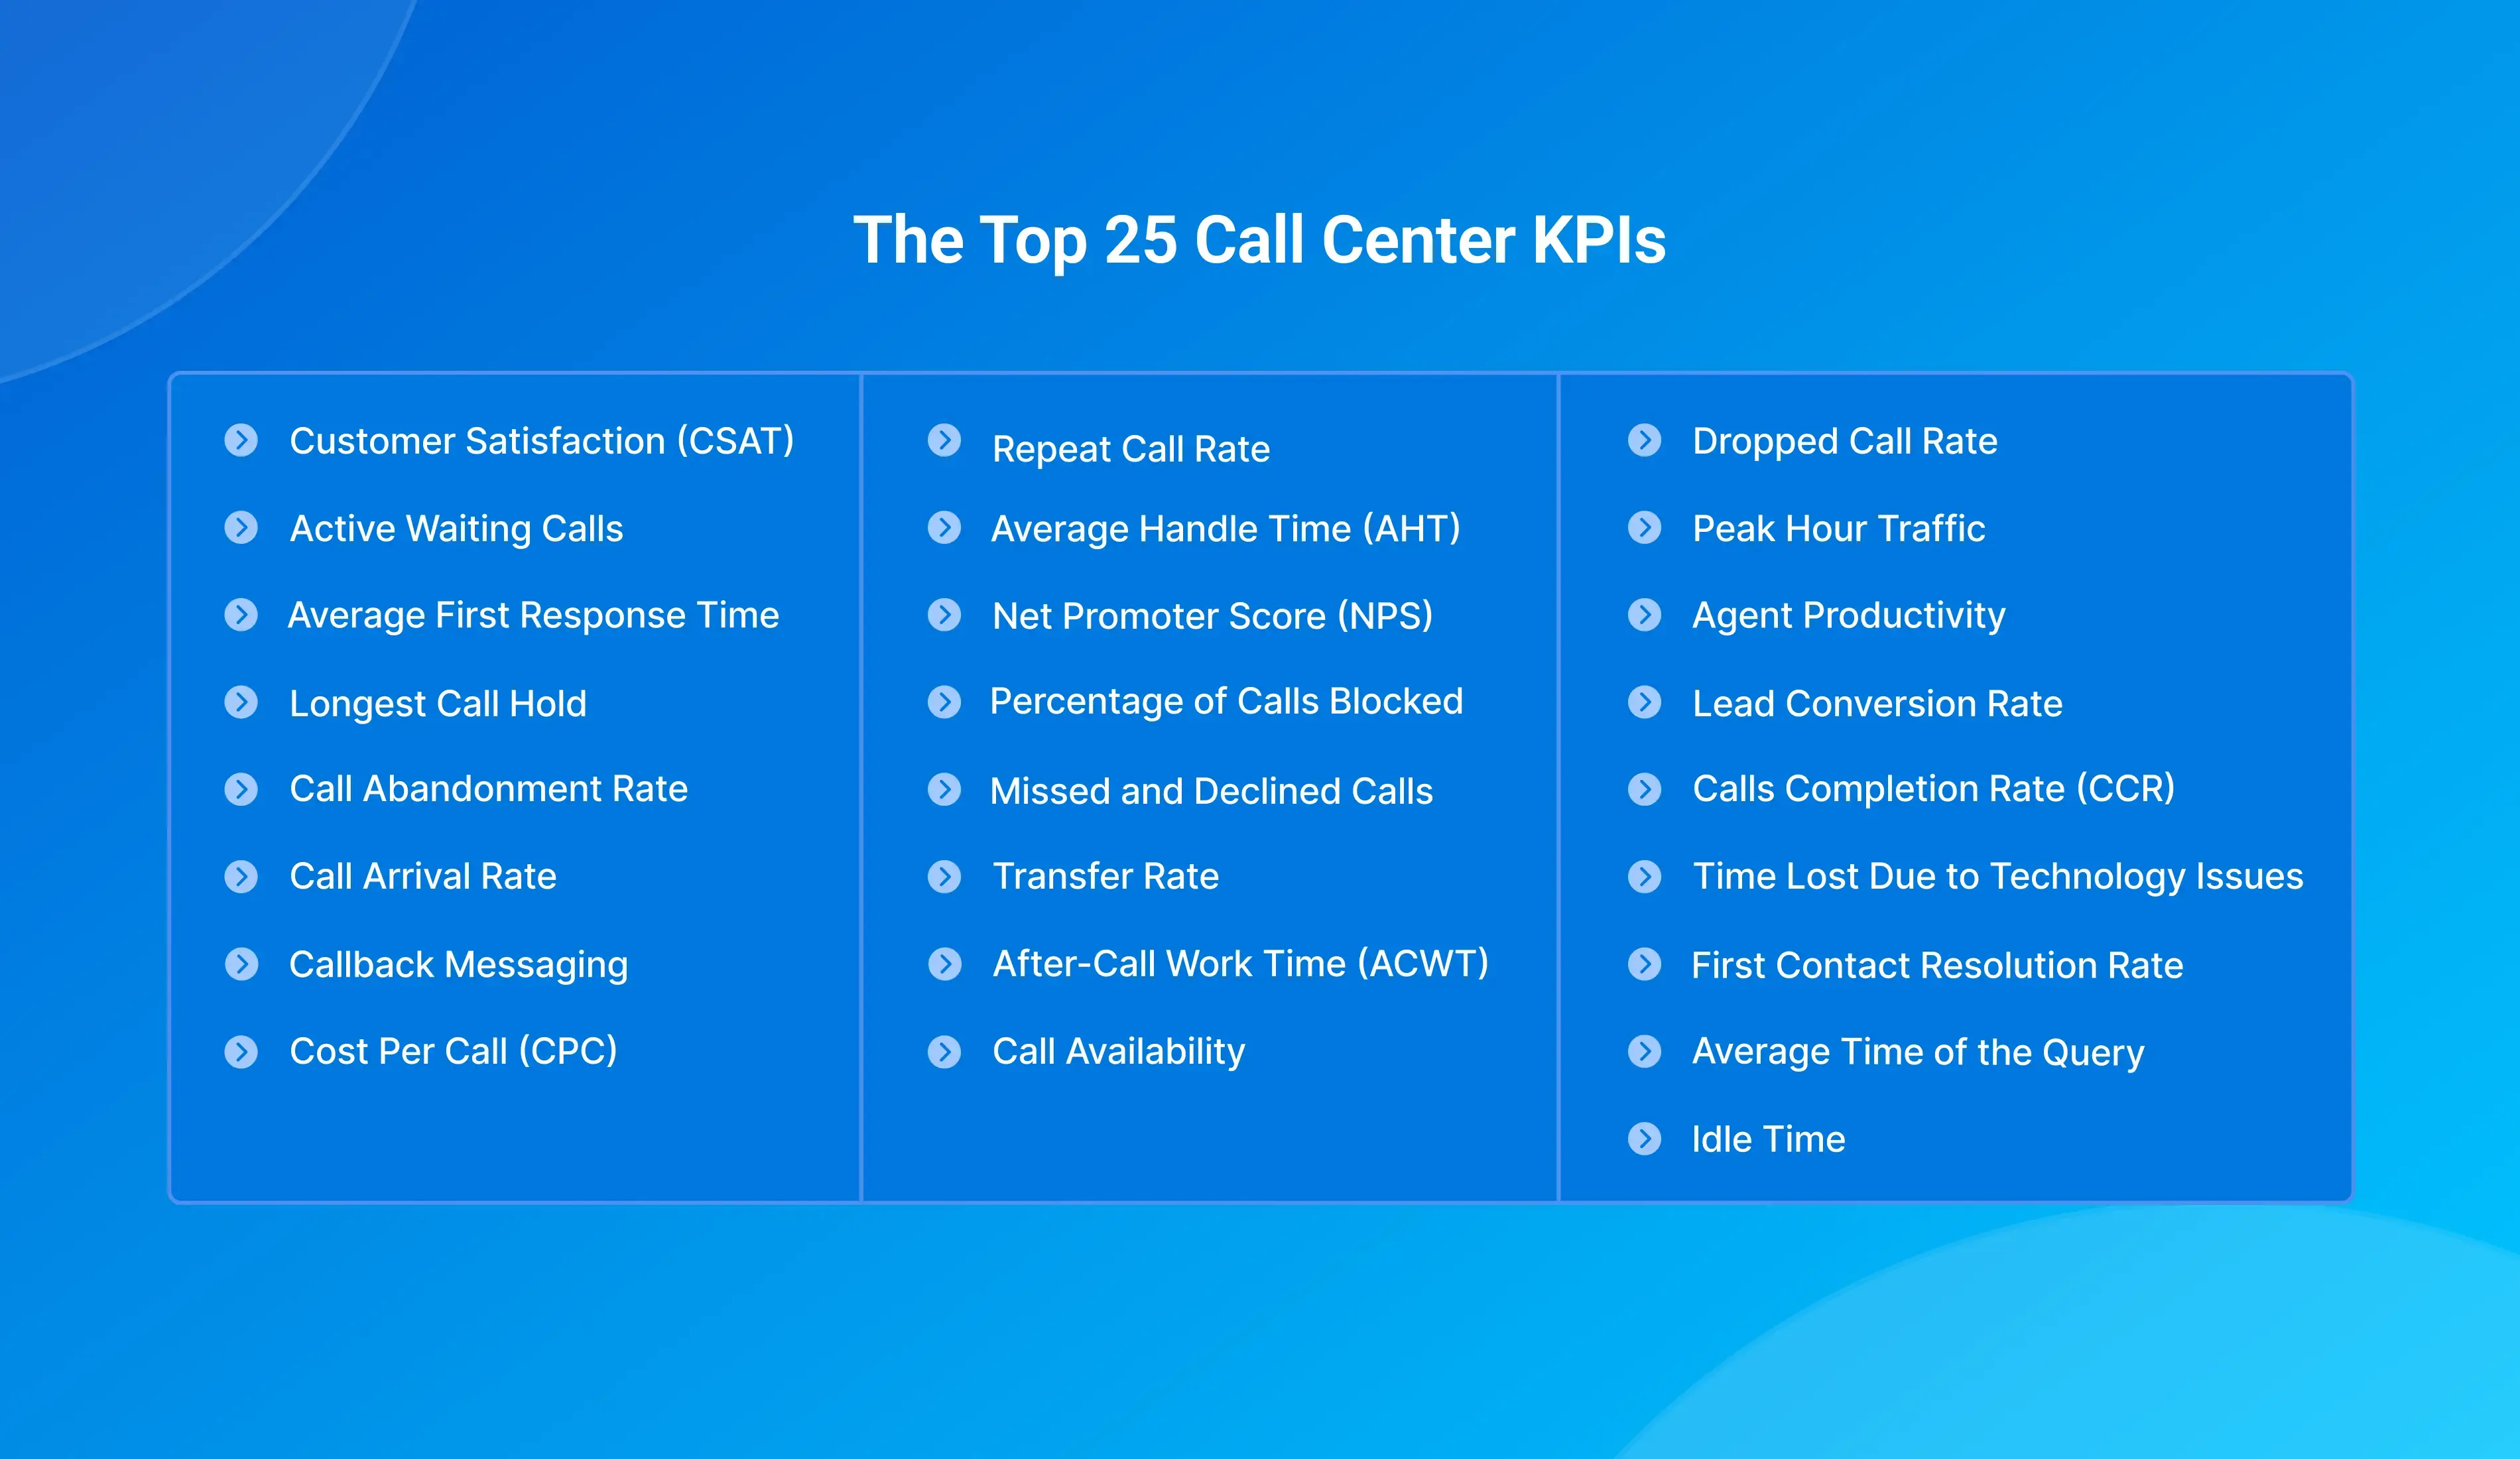
The Top 25 Call Center KPIs to Note Down:
1. Customer Satisfaction (CSAT)
Customer Satisfaction is a vital factor that every business should consider. It is one of the call center KPIs that measure how satisfied customers are with your product or service. The KPIs range from 1 to 5, with 1 meaning ‘highly unsatisfied’ and 5 meaning ‘fully satisfied’.
CSAT= Number of satisfied customers/Number of survey responses X 100
It is said that call centers typically want to achieve a CSAT score of around 80%. In order to increase the score, you can reduce on-hold time, make use of IVR phone system, address the customers with their names for personalization, etc.
2. Active Waiting Calls
The next important factor to consider is the queue's number of active waiting calls that are being put on hold. The lower the rate, the higher the customer satisfaction will be.
Active Waiting Calls= Number of customers waiting on hold at a given time
In order to reduce the waiting rate of customers on hold, you can increase the number of staff. Apart from this, you can route calls to the available agents and also provide self-service chats or portals.
3. Average First Response Time (FRT)
This metric measures the average amount of time customers have to wait before having their queries addressed. It is the sum total of this time across customer support mediums, including emails, social media, etc.
FRT= Total time spent waiting for a response/ Total number of incoming queries
First Response Time targets will vary based on the communication medium. If it is a chat, the customer will wait for half a minute or so. While for phone calls, a customer may wait for 3 minutes maximum. In order to maintain a good FRT, a business should automate workflows whenever possible. You can also reduce multitasking and concentrate more on customer queries initially who are waiting for a long time.
4. Longest Call Hold
The Longest Call Hold is a significant metric that carries a high weightage and should be considered when discussing call center KPIs for call center team managers. It displays both the target hold time and the longest hold time till the date.
Managers monitoring the most extended call holding time can take steps to make sure that customer loyalty does not fall due to exorbitant wait times and alter the call agent numbers. Hence, there are more employees available to manage calls.
5. Call Abandonment Rate
The Call abandon rate provides managers with insight into the number of callers who have disconnected before interacting with the agent. This metric also gives the disconnected call numbers context by tracking the data alongside active and on-hold calls.
Call Abandonment Rate= (Number of calls placed- Number of calls handled)/ Number of calls placed x 100
A call abandonment rate should be between 5 and 8 percent. Call centers should try to achieve this ratio. In order to reduce the call abandonment rate, businesses can offer self-service options, dial abandoned calls during off-peak hours, and play some engaging music or announcements to the customers.
6. Call Arrival Rate
The call arrival rate measures the call center’s volume of incoming calls for a given period of time. This is usually tracked daily. Depending on which trends your operations management team finds to be more beneficial, they can fix the preferred time frame for the metric—be it a day, hour, or minute.
Call Arrival Rate= Total number of calls received in a given period/ (Total number of hours or minutes or seconds in the same period)
The target for this call center KPI varies depending on the size of the business. Smaller companies could shoot for 25 calls per day. Larger companies can see hundreds of inbound calls per day.
When improving the call arrival rate, you must consider different variables. For instance, the call arrival rate will be lower if the customer is satisfied with your product or service despite your high volume. If they are unsatisfied with your service, they will contact customer service to resolve it. To manage this, you can introduce an FAQ section and provide answers to common queries. You can also automate a feedback-sharing mechanism.
7. Callback Messaging
As the name suggests, the callback messaging KPI is the number of callback messages a call center receives on a given day. Many callback messages mean you are leaving too many customers on hold for a long time. To tackle this situation, you can hire more agents and increase productivity.
This option helps businesses track the number of callback requests during a specific period of time so they can determine how many customers selected the callback messaging option. This call center KPI allows businesses to plan staffing requirements, improve agent productivity, and increase customer experience.
8. Cost Per Call (CPC)
Cost Per Call is a call center metric and KPI that tracks the average cost of each call handled by the agent. This KPI is crucial since it offers insight into the cost-effectiveness of your call center operations and paves the way for resource allocation. Management can determine if resource allocations need to be adjusted.
Cost Per Call= Total cost of all calls/ Total number of calls
To improve CPC, you can utilize a remote work model, monitor the performance metrics and KPIs, enhance training sessions, and use a cloud-based pbx system.
9. Repeat Call Rate
A repeat call rate helps businesses understand which issues were not resolved initially. Tracking repeat calls and obtaining customer feedback can reveal recurring issues, allowing management teams to find resolutions and prevent problems from repeating.
Repeat Call Rate= Number of calls related to the specific issue/ Total number of calls
To improve repeat call rates, businesses can determine the common recurring issues and offer agents training based on them. This also allows companies to integrate different solutions, such as self-service options, which can help customers resolve their issues by themselves rather than waiting for a call center agent.
10. Average Handle Time (AHT)
.webp)
Average Handle Time (AHT) is a metric that represents the average amount of time an agent spends on a single call. By tracking this metric, businesses can evaluate the average handle times for various types of calls and fix standards for different teams.
You should make sure your agents find a balance between speed and good customer service. Agents with a higher AHT will not address the customer needs and can be considered to lack skills, tools, or training for promptly handling customer issues.
Average Handle Time= (Talk time+ Hold time+ Wrap time)/ Total number of calls
To improve AHT, companies can offer in-depth training sessions to call center agents, route calls to the appropriate agents, direct customers to self-service options, and provide efficient call center scripts to be followed.
11. Net Promoter Score (NPS)
The Net Promoter Score corresponds to customer loyalty. This metric concerns long-term customer satisfaction and is evaluated through a survey that businesses can send quarterly or bi-quarterly. For instance, an NPS will post a single question such as “How likely would you recommend our product to your friend or colleague?” and offer a weighing scale of 0-10. Businesses can also have the option of letting their customers register their feedback in the comment box.
Customer responses can be divided into three categories:
- Promoters: These customers give a rating of 9 or 10. They are loyal users who are likely to repurchase your product/service and even share a referral code to bring in new customers.
- Passives: These customers would leave a rating of 7 or 8. They are satisfied with your brand but would be taken by competitors at any time.
- Detractors: This represents unsatisfied customers who respond as 6 and below. They are risky and can spread negative reviews anywhere.
NPS= Percent of promoters- Percent of detractors
To improve NPS, you can concentrate on customer feedback based on the ratings given. This can help you understand why customers are loyal to your brand, what stops them from becoming promoters, and what lousy experience detractors have. With this information, you can identify what to fix and what to continue to boost the customer experience across the globe.
12. Percentage of Calls Blocked
This is one of the call center's key performance indicators, referring to the number of incoming customer calls that encounter a busy signal. For example, when a customer calls the service center and listens to a busy signal on the line, their customer experience will be poor right from the beginning. Hence, it is essential to have this metric very low.
If agents are not able to pick up a large number of calls, businesses should determine a way to ensure that the phone calls are handled properly without any delay. You can look into the call duration metrics to check if calls with excessive call length are leading to busy signals for other customers.
Percentage of calls blocked= (Number of calls that failed to reach agents/ Total number of incoming calls) X 100
To improve this metric, businesses can invest in CRM software that comes with automation options. Automated call volume features include auto-transfer, AI-powered IVR, and more. IVR can handle, and finely route customer calls to the respective teams or departments.
13. Missed and Declined Calls
When the call center agent misses or declines a customer call, the customer will be sent back to the queue. Moreover, a large number of missed and declined calls will lead to poor customer satisfaction and service.
In order to improve this call center KPI metric, businesses should understand the two main reasons for missed and declined calls: lack of staffing and inefficient call center software. If missed and declined calls are high during the peak hours of the day or shift, there might not be sufficient agents to handle the high volume of calls. In this case, you can hire more agents to tackle this situation.
If you have a good number of agents and are still experiencing problems, the system will be poor and deliver a bad experience. Consider upgrading your subscription plan or switching to another inbound call center software provider in the market.
14. Transfer Rate
Transfer rate is another call center KPI metric that denotes the percentage of inbound calls that agents transfer to other teams, departments, or agents.
Transfer rate= (Total number of calls transferred to another agent or department/ Total number of calls handled)
A higher transfer rate could indicate that customers are initially reaching the wrong team or agent. In this case, there could be some problems with the call center’s internal routing system. Hence, you can check with customers if they find the best IVR software confusing or challenging to navigate. If the answer is yes, you can rework the routing process with IVR services.
On the other hand, if the IVR is working correctly but the issue still permits, you can calculate the average transfer rate across the entire call center. You can identify the respective agents and provide a proper training session for them. Maybe they are not entirely aware of the departments.
15. After-Call Work Time (ACWT)
ACWT is a metric that calculates the average amount of time spent doing wrap-up work. This means the required work is to be done at the end of every call to categorize and keep track of the interaction finely.
Here are a few such activities which they have to perform:
- Documenting the outcomes of the customer interaction
- Sending follow-up emails
- Sharing the required resources with the customers
- Assigning tasks to other departments
ACWT= (Total handle time- Total hold time & Total talk time)/ Total number of customer calls
In order to improve ACWT call center KPI, businesses can reduce wrap-up time by automating a few tasks with the CRM system. You can also develop a standard FAQ page for the agents to help them send out mail quickly to the customers.
16. Call Availability
Call availability is one of the call center’s key performance indicators (KPIs). It shows the total time your agents are available to pick up calls and how long they take to resolve customer issues. This metric offers companies crucial data that reveals whether agents are sticking to their working schedules.
If the agent's availability is low, the manager can look into the agent's respective caller records and see how they managed the time. Identifying suitable agents during peak hours and appropriately routing the customers' calls is also essential.
17. Dropped Call Rate
The dropped call rate refers to the percentage of phone calls that were cut off due to technical issues before the communication was finished on both ends. There can be various reasons, such as inadequate coverage, poor signal, network issues, etc.
Dropped Call Rate= (Total number of calls dropped/ Total number of calls received) X 100
To reduce dropped call rates, ensure you have a stable internet connection and check for network quality frequently.
18. Peak Hour Traffic
Peak-hour traffic is yet another consideration of KPIs for Call Center Team Managers. It represents when the call center experiences the most call traffic or call volumes in a day. It allows businesses to plan ahead of time and schedule enough to handle high volumes of calls during a specific period.
You need to track the daily call volume to calculate Peak Hour Traffic. This can help you determine what time of day you have the most enormous customer call traffic, and you can make the arrangements accordingly.
19. Agent Productivity
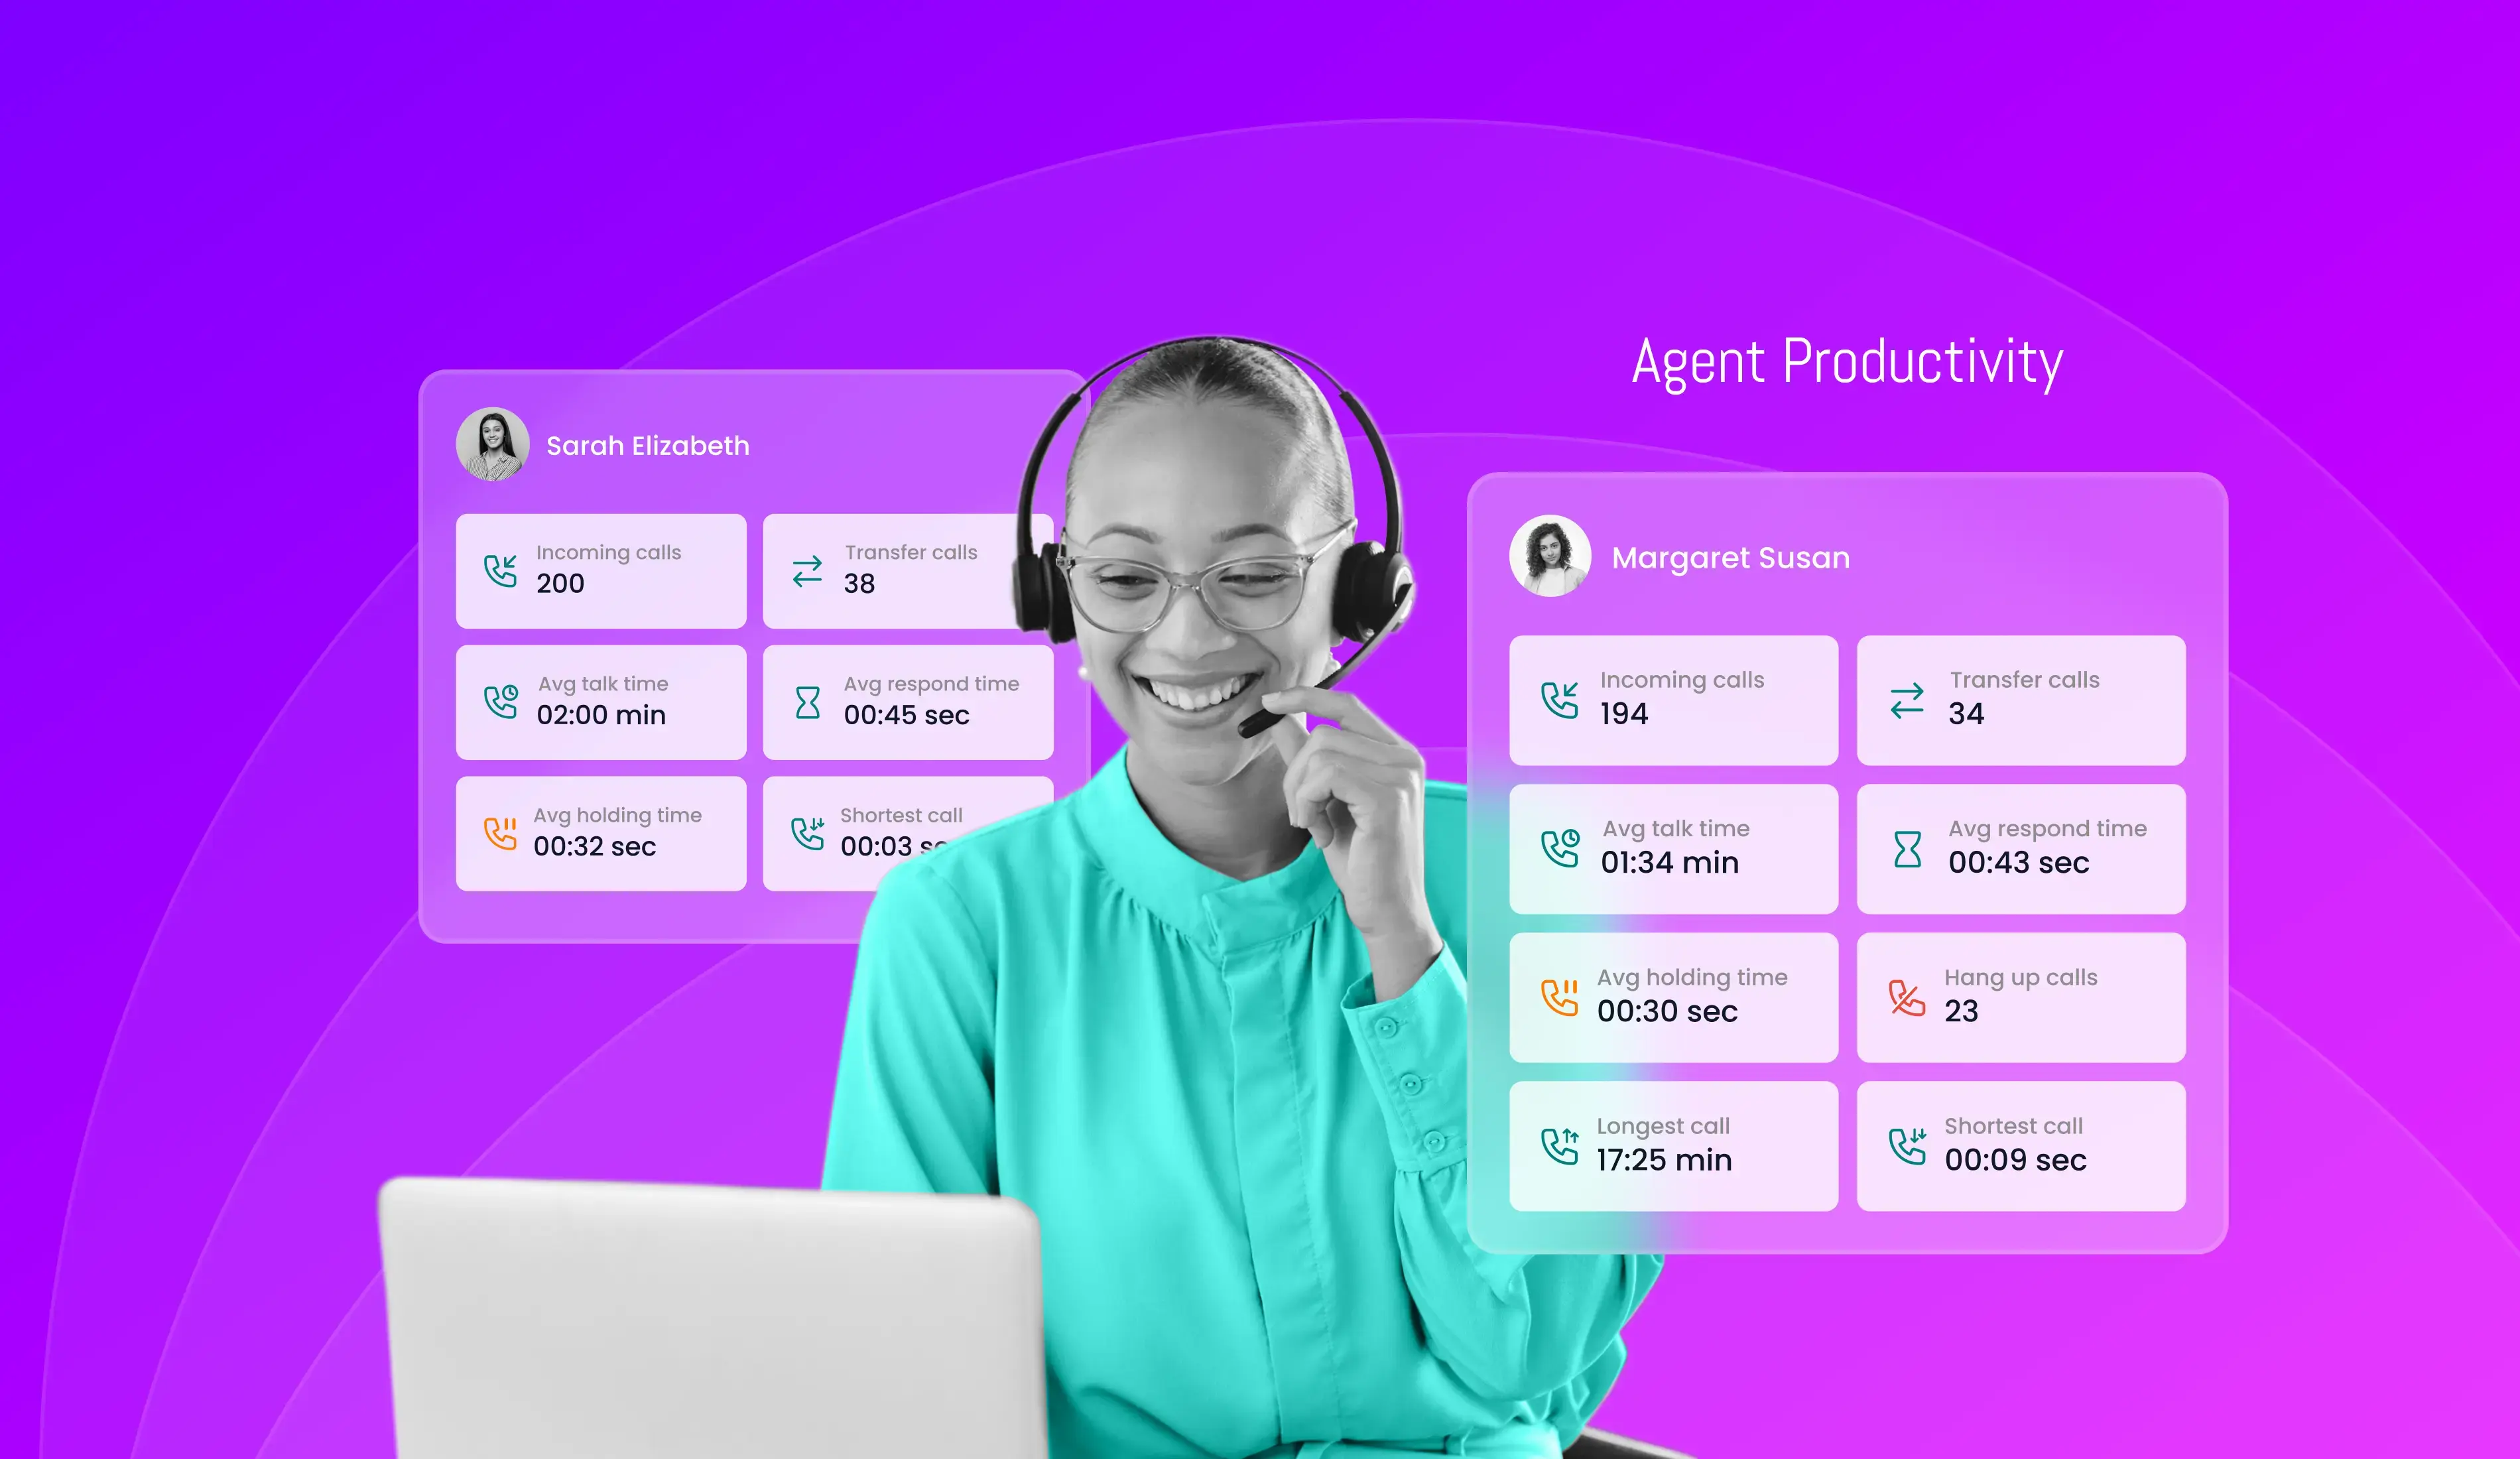
Calculating the call center agent’s productivity is vital. This KPI can offer a view into the total share of time call agents spend on calls or work on call-related tasks. Also, when the target value is fixed, this call center metric can help team managers analyze how productive their team is and how they are achieving the goals. Moreover, team leaders can also take respective steps or adjust the business workflow based on the filtered results.
Agent Productivity= (Total input/ Total output) X 100
20. Lead Conversion Rate
The lead conversion rate is a call center KPI metric that shows the number of leads generated by the organization that result in a successful sale. It also evaluates the efficiency of the company’s sales funnel and helps to enhance the conversion rate.
A poor conversion rate indicates that the organization needs to take additional steps to convert a lead into a buyer. Additionally, a 2-5 percent conversion rate is considered decent.
Lead Conversion Rate = Total number of leads converted to opportunities in a specific period/Total number of leads targeted.
21. Calls Completion Rate (CCR)
Call Center Managers should evaluate the total share of the calls that are successfully connected and completed versus the share of the calls that are unsuccessful. This ratio typically indicates either a percentage or a decimal fraction. This call center KPI metric offers an indication of the call attempts that resulted in a live conversation or response.
22. Time Lost Due to Technology Issues
Although technology is a savior in the current era, there are times when it goes down and creates a barrier to businesses. As a team leader or manager in your organization, you should understand the amount of downtime that results in technical glitches such as server issues, network issues, power outages, and other challenges. To rule out this, you must check and work on your frequent issues.
Time lost due to tech issues = Total amount of time when the system was idle during working hours due to technical issues
23. First Contact Resolution Rate
The first contact or call resolution rate is the percentage of tickets an agent resolves on their first attempt. This resolving attempt can be in any mode, such as a phone call, a single email response, or a live web chat interaction. Tracking FCR can provide businesses with a view of how their customer support team is working to meet customer expectations.
FCR= Total number of one-touch tickets/ Total number of tickets resolved
To improve FCR, you can train your team on how to resolve the queries in the initial attempt, practice customer scenarios, etc.
24. Average Time of the Query
This is yet another call center KPI metric that determines how long each query remains active. To put it simply, it is the average amount of time that each case remains open or the amount of time required for resolving it. The average time for the query to resolve should be ideally low. You can calculate this metric frequently to optimize performance.
Average Time of the Query= Average time taken by an agent to resolve a query/ Total number of queries resolved in the specific period
25. Idle Time
Calculating idle time is essential to remaining productive in the environment. You can measure the amount of time an agent spends doing things that are not related to the work. This can include coffee breaks, lunchtime, speaking with colleagues, etc.
Conclusion:
It is important to know the KPIs to determine the call center's performance. With the data obtained from these metrics, businesses can analyze and make futuristic decisions to reap benefits.
TeleCMI, the leading cloud services provider, can assist you in enhancing your business growth and instant customer engagement that makes your brand look unique from the rest. We manage the critical areas of communication in the VoIP, Call Centers, Cloud Telephony, etc, to help businesses streamline their operations.
Ready to Improve Your Call Center KPIs?

List of Essential KPIs
Actionable Insights
Both Inbound & Outbound Call Centers
Frequently asked questions (FAQ)
Vignesh N

With deep expertise in cloud telecommunications, I help readers explore the latest trends in VoIP and modern business communication. At TeleCMI, I focus on educating businesses with clear, practical insights, making complex telecom concepts easy to understand. I’m passionate about helping organizations improve efficiency, enhance customer engagement, and adopt smarter communication strategies.